 Pixel Debugger
Debug your marketing pixels in Chrome
See every event Meta, GA4, Google Ads, TikTok and 45 more pixels send, right next to your site. Check that each one fired, reached the right account and carries the right value, currency and order ID.
- Free, no account
- 49 networks
- Nothing leaves your computer
Reads the events of 49 ad and analytics networks, each in its own format


Everything you check pixels for, in one side panel
No more digging through DevTools, encoded URLs or one helper extension per network.
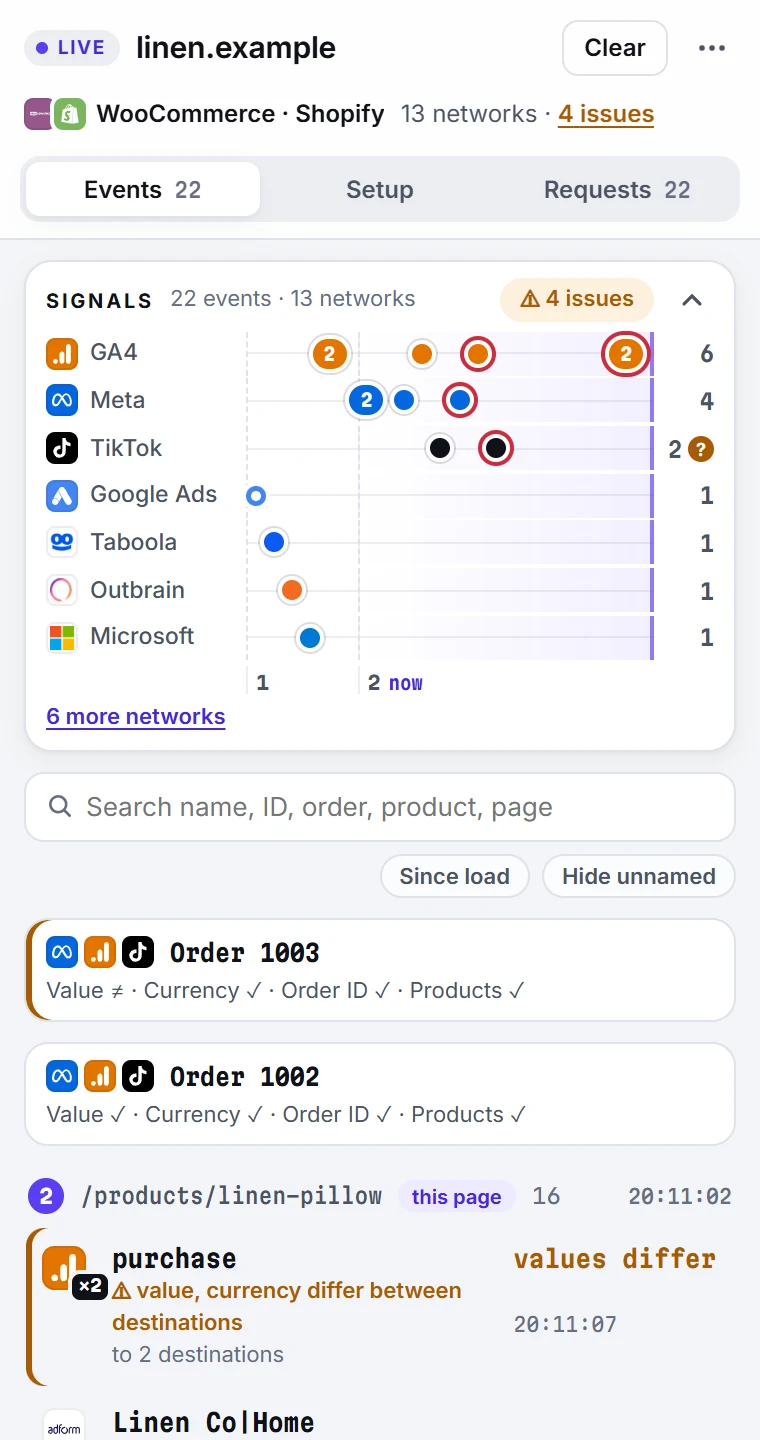
See every event the moment it fires
Open the side panel and click through your site. Each event appears as the page sends it, under the exact name it was sent with, grouped by page visit.
- All networks on one timeline
- Requests without an event name are labelled as such
- Keeps your product, cart and checkout run until you clear it
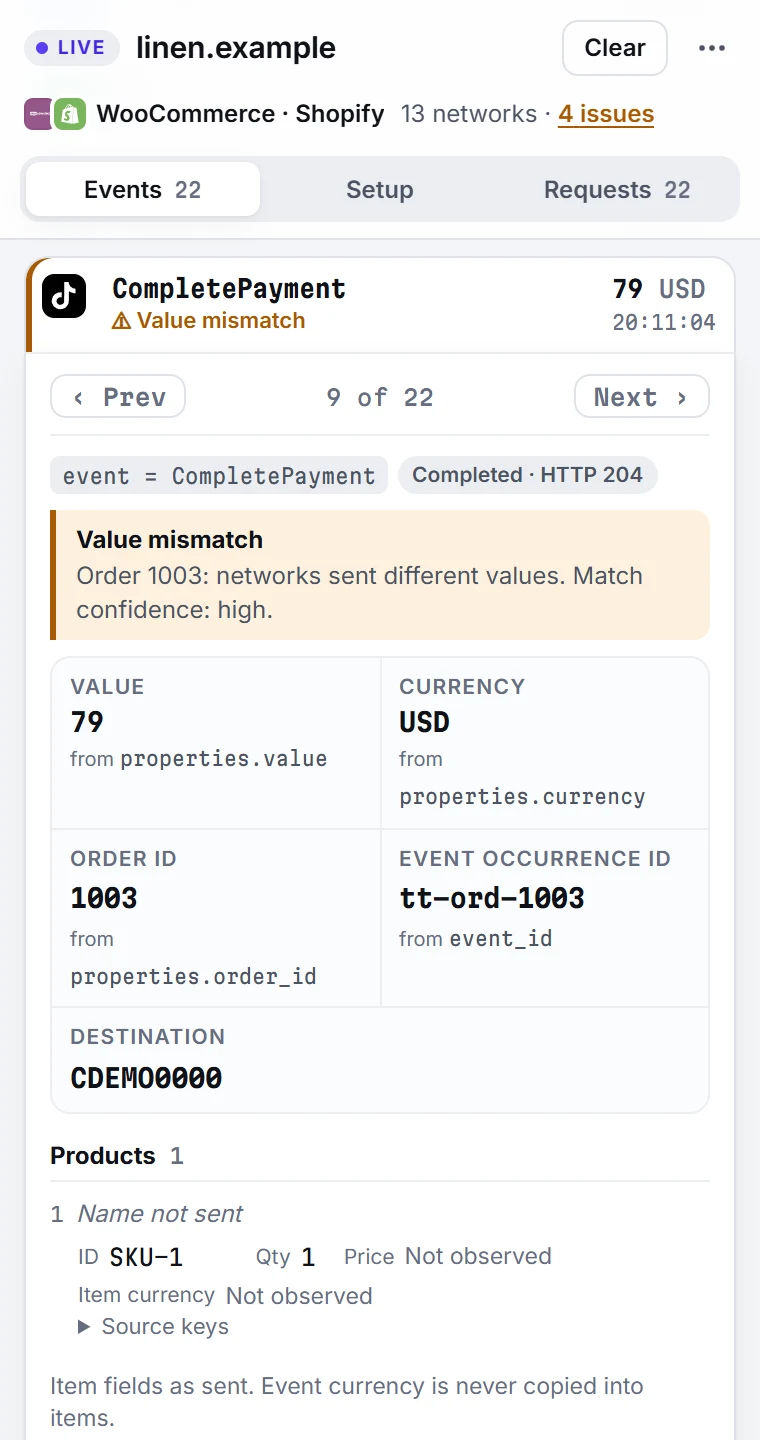
Check the value, currency and order ID
Open an event to see what it carried: every value with the key it came from, the destination it went to and the products in it.
- Invalid values and currencies are flagged
- A currency that wasn't sent shows as not sent, never guessed
- Every parameter the network supports, sent or not
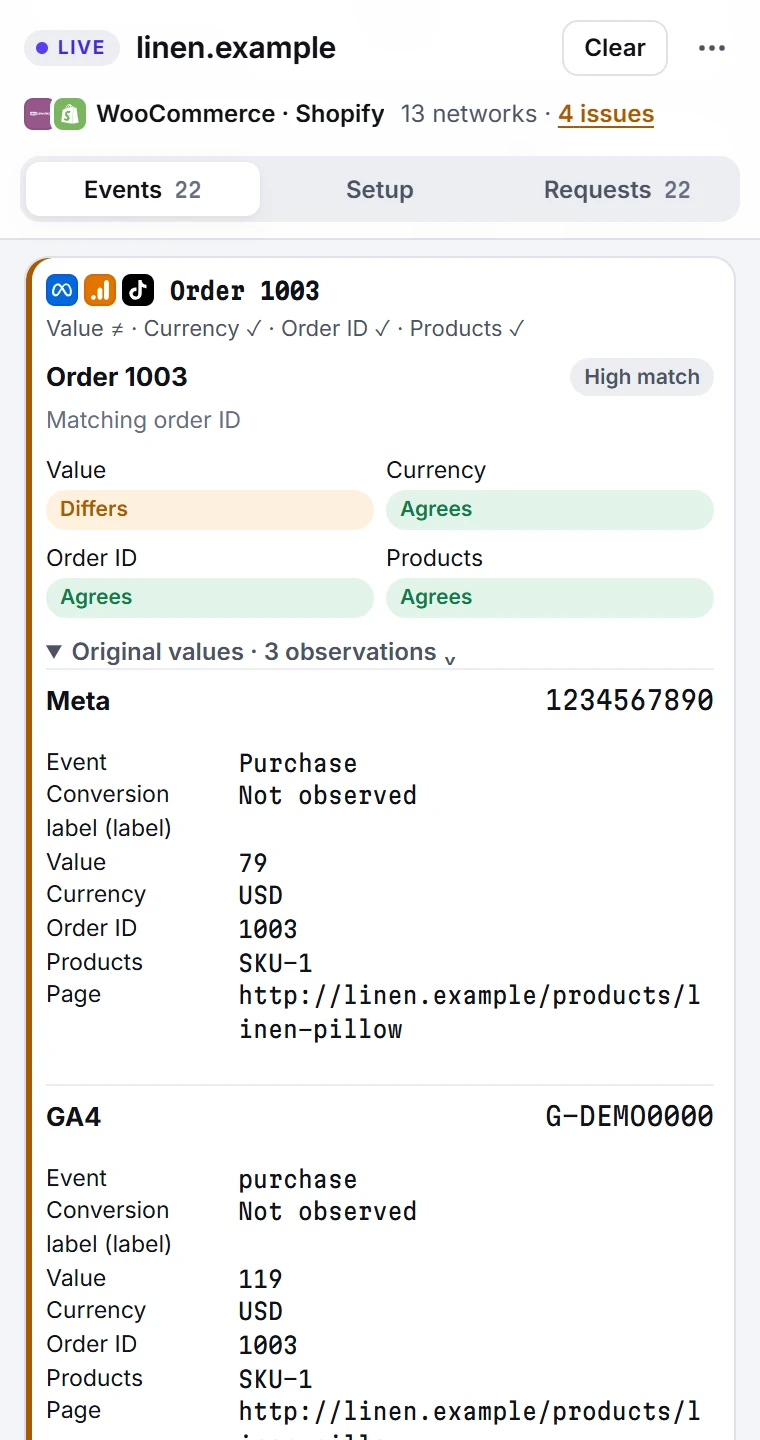
Find out why Meta and GA4 disagree
When several networks receive the same order ID, their values, currencies and products are lined up side by side and every difference is flagged.
- One order, every network, one view
- The same event sent to several pixels shows each destination
- Potential duplicates seconds apart are flagged
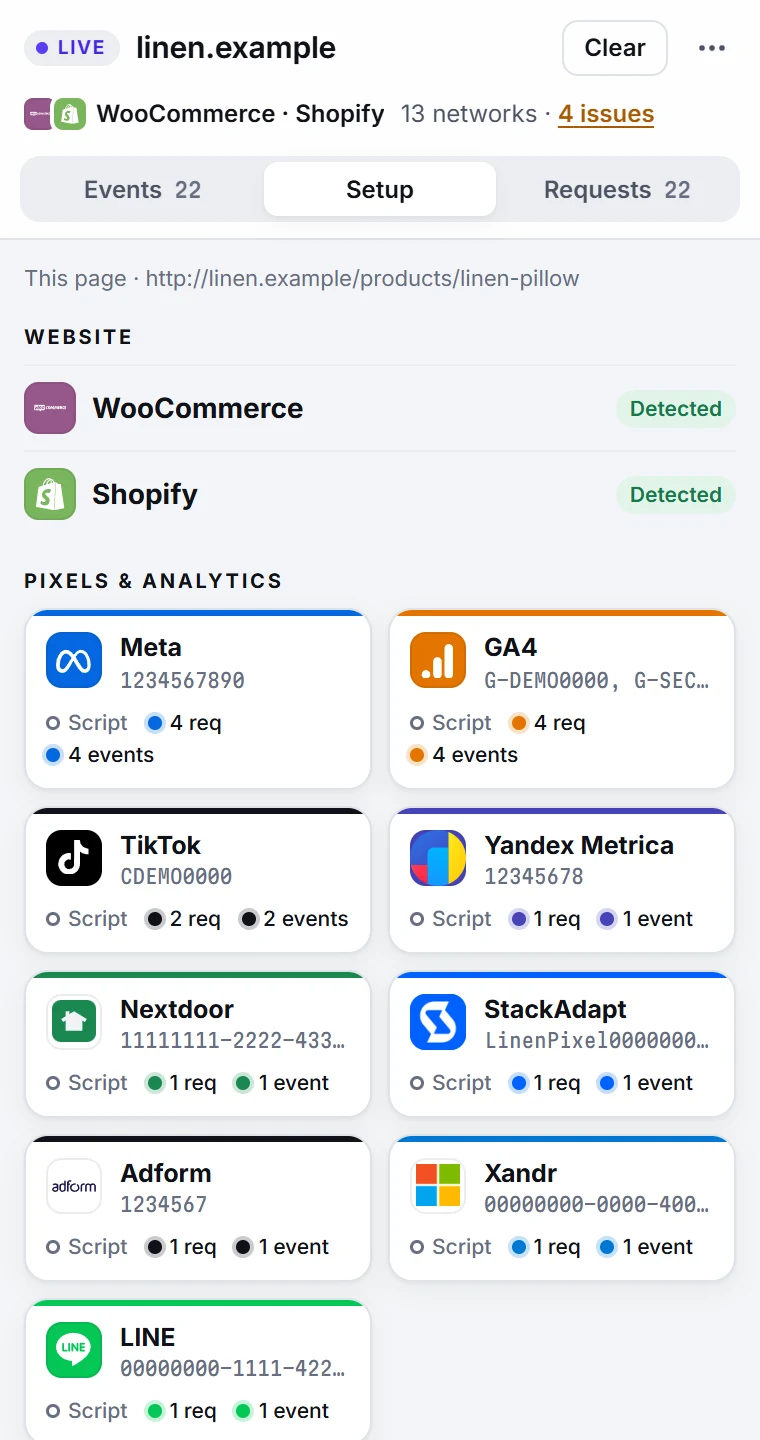
See which pixels are installed
Setup shows the site's platform and, for each network, whether its script was found, whether it sent requests and whether those carried events.
- Pixel, property and account IDs at a glance
- Google consent-mode commands the page issued
- Click IDs and UTM parameters of the visit
Made for the people who own the tracking
- Performance marketersCheck a campaign's conversion events before you spend on it, and after every site change.
- AgenciesAudit a new client's pixels in minutes and show them exactly what each network receives.
- Analytics specialistsVerify GA4 and every ad pixel side by side, with each value traced to its key.
- DevelopersTest a tag or data layer change on your own machine, without opening the network panel.
Private by design
The Pixel Debugger extension has no server and needs no account. Everything it captures stays in your browser. This website loads Google Analytics only if you allow it.
- It only watches. It never blocks or changes a request.
- It never sends what it sees anywhere.
- It never hides a value: what the network received is what you see.
Guides
Answers to the questions that come up when ad and analytics numbers don't add up.
- What tracking pixels actually send: a study of 38 websitesWe opened 38 websites with Pixel Debugger and read every tracking request: how many networks fire, where events go, and what is missing.
- Duplicate purchase events: real duplicates vs. normal repeatsSeveral purchase requests for one order are often normal: several pixels, accounts or request formats. How to find a real duplicate and check the order ID.
- GA4 events not showing: check what the tag actually sentWhy a GA4 event or purchase doesn't show in your reports: report delays, consent mode, the wrong measurement ID, first-party tag paths, batched and cancelled requests, and the purchase fields Google requires.
- GA4 purchase sent with a value but no currencyA GA4 purchase with a value but no currency: the keys to look for in the request, what Google's reference says about it, and how to check and fix the tag.
- Why one Google Ads hit shows up as several requestsOne Google Ads conversion can leave the browser as conversion, view-through, CCM and GA4-linked requests. What each carries and why it is not a duplicate.
- Google Ads conversion not recording: what to check in the browserWhy a Google Ads conversion action shows no conversions: the status meanings, what a conversion request looks like, and how to check the account, label, value, currency, order ID and consent your tag actually sends.
- Why Meta and GA4 report different revenueWhy Meta, GA4 and Google Ads report different revenue for the same orders, and how to see the value, currency and order ID each tag sent in the browser.
- Meta Pixel not firing: how to find out whyCheck whether your Meta Pixel sends events: what a Meta Pixel request looks like, the eight usual reasons it doesn't fire or sends the wrong data, and how to check each one in Chrome.
Questions
Is Pixel Debugger free?
Yes. It is free and needs no account or sign-up.
Which pixels and networks does it support?
49 ad and analytics networks, including Meta, GA4, Google Ads, TikTok, Pinterest, Snapchat, Reddit, LinkedIn, Microsoft Advertising and X. Each is read in its own request format. See the full list.
How is it different from Meta Pixel Helper or Google Tag Assistant?
Those each show one company's tags. Pixel Debugger shows every supported network in one side panel, so you can see all the pixels on a page at once and compare what each one received for the same order.
Does it work with Google Tag Manager, Shopify apps or hard-coded pixels?
Yes. It reads the requests the pixels send from the browser, however the tags were installed.
Can it see server-side tracking, such as the Conversions API?
No. It shows what the browser sends. Events sent from a server never pass through the browser, so they are not visible here.
Does it send my data anywhere?
The extension sends no captured data anywhere and needs no account. Everything it captures stays in your browser. This website uses optional Google Analytics only after you allow it. Read the privacy policy.
Does it change or slow down the sites I test?
No. It only watches requests; it never blocks or changes them, so sites behave exactly as they do without it.
Why don't I see any events?
Reload the page first: a tab that was open before the extension was installed has nothing captured yet. Many tags also wait for an answer to the consent banner, and an ad blocker can stop pixels from sending anything.
Start debugging your pixels
Free for Chrome. Install it, open your site, click the icon.